Sea Level Bias in the Tropical Pacific across Ocean Models
A sea level trend bias across ocean models has been identified in the previous version of Ocean Model Inter-comparison Project (OMIP) [Griffies et al., 2014]. The new version - OMIP II, though significantly reduced the trend bias, still shows a zonally structured sea level bias across the tropical Pacific. To find out the reason that causes the sea level bias, this study investigates the two different forcing data based on CORE forcing (OMIP I) and JRA55-do forcing (OMIP II) across multiple time scales [Hsu et al., 2021].
We perform the sea level analyses in the model simulations from two forcing data by comparing with the available observations across different time scales including mean state, long-term trend, seasonal signal, and inter-annual signal. We find that sea level biases across different time scales are strongly related to surface wind forcing.
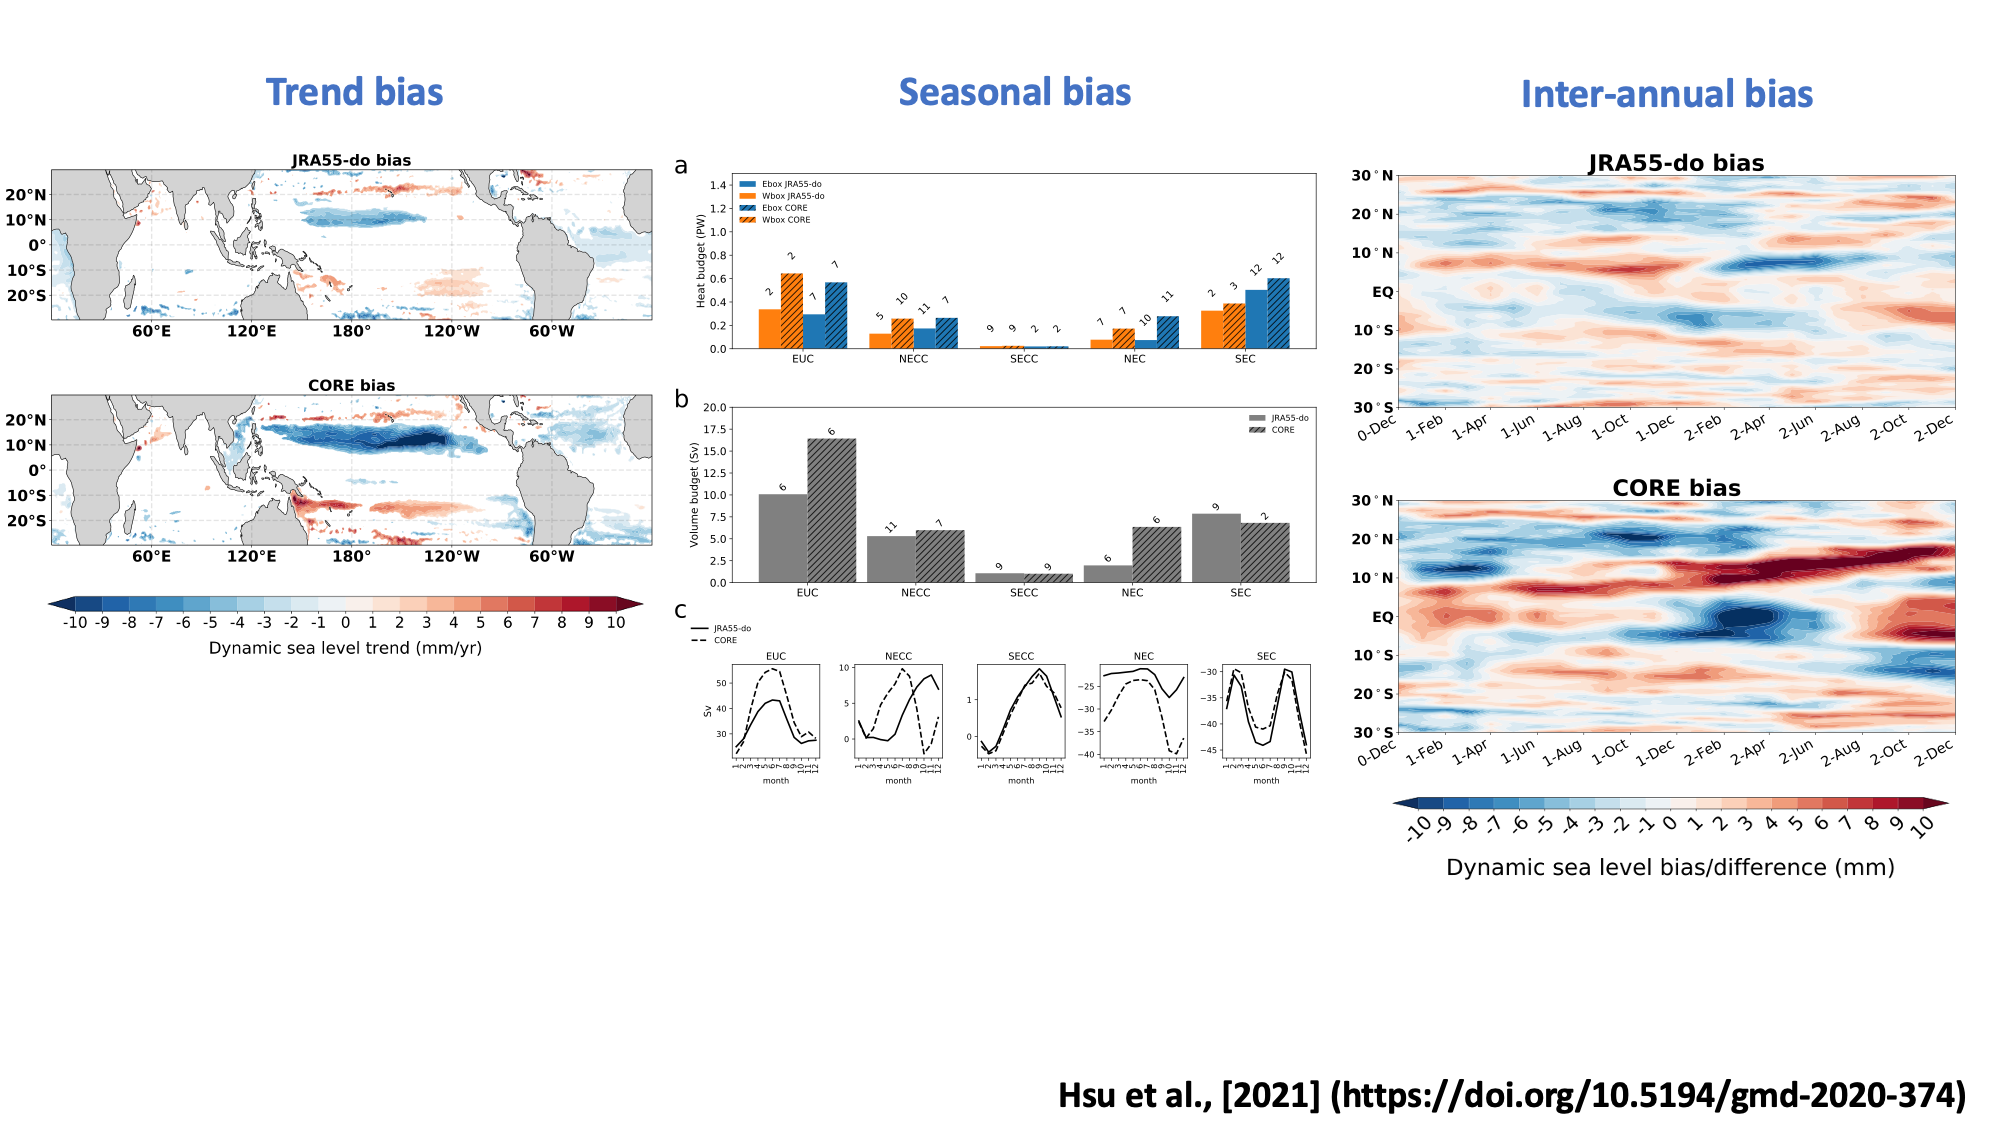 For instance, the trend bias in the left panel is significantly reduced in the simulation forced by new reanalysis data from JRA55-do compare to the previous CORE forcing due to the improved wind stress trend signal in the eastern tropical Pacific.
Over the seasonal time scale in the middle panel, due to the more accurate timing of wind stress curl forcing in the JRA55-do, a more accurate first baroclinic Rossby wave in the form of sea level helped generate a more realistic seasonal amplitude and phase of North Equatorial Counter Current (NECC).
The improved wind forcing also shows improved sea level simulation during El Niño shown in the right panel.
For instance, the trend bias in the left panel is significantly reduced in the simulation forced by new reanalysis data from JRA55-do compare to the previous CORE forcing due to the improved wind stress trend signal in the eastern tropical Pacific.
Over the seasonal time scale in the middle panel, due to the more accurate timing of wind stress curl forcing in the JRA55-do, a more accurate first baroclinic Rossby wave in the form of sea level helped generate a more realistic seasonal amplitude and phase of North Equatorial Counter Current (NECC).
The improved wind forcing also shows improved sea level simulation during El Niño shown in the right panel.
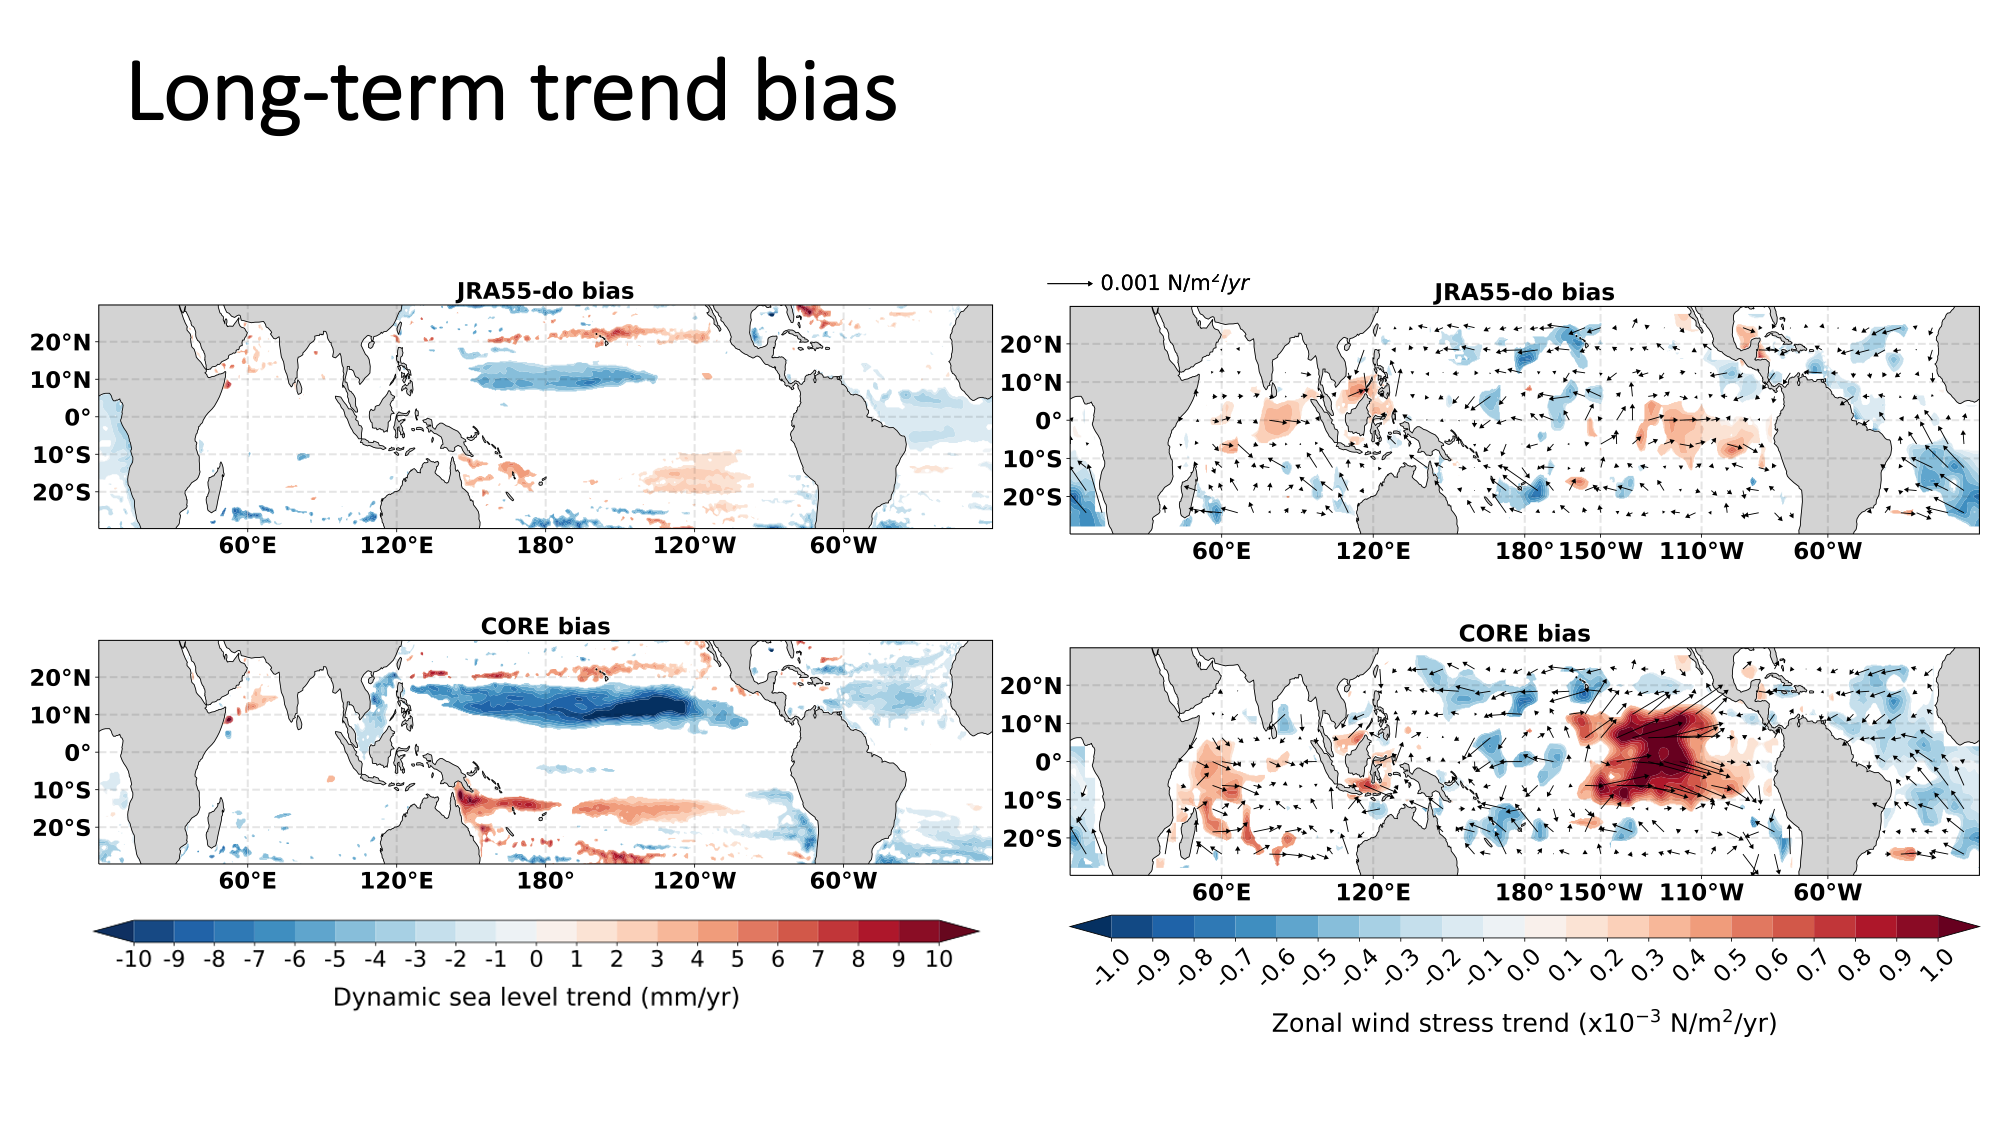 To understand what causes the trend bias, we analyze the surface forcing data and find that the bias of westerly wind trend in the eastern tropical Pacific in CORE is the main reason to cause the positive wind stress curl bias.
The westerly at the equator creates an Ekman suction bias north of the equator which results in the sea level to bias low in the model simulation.
The bias of easterly wind trend around 20N also contributes to the zonally structured sea level trend bias which still exists in the JRA55-do forced simulation near the dateline.
To understand what causes the trend bias, we analyze the surface forcing data and find that the bias of westerly wind trend in the eastern tropical Pacific in CORE is the main reason to cause the positive wind stress curl bias.
The westerly at the equator creates an Ekman suction bias north of the equator which results in the sea level to bias low in the model simulation.
The bias of easterly wind trend around 20N also contributes to the zonally structured sea level trend bias which still exists in the JRA55-do forced simulation near the dateline.
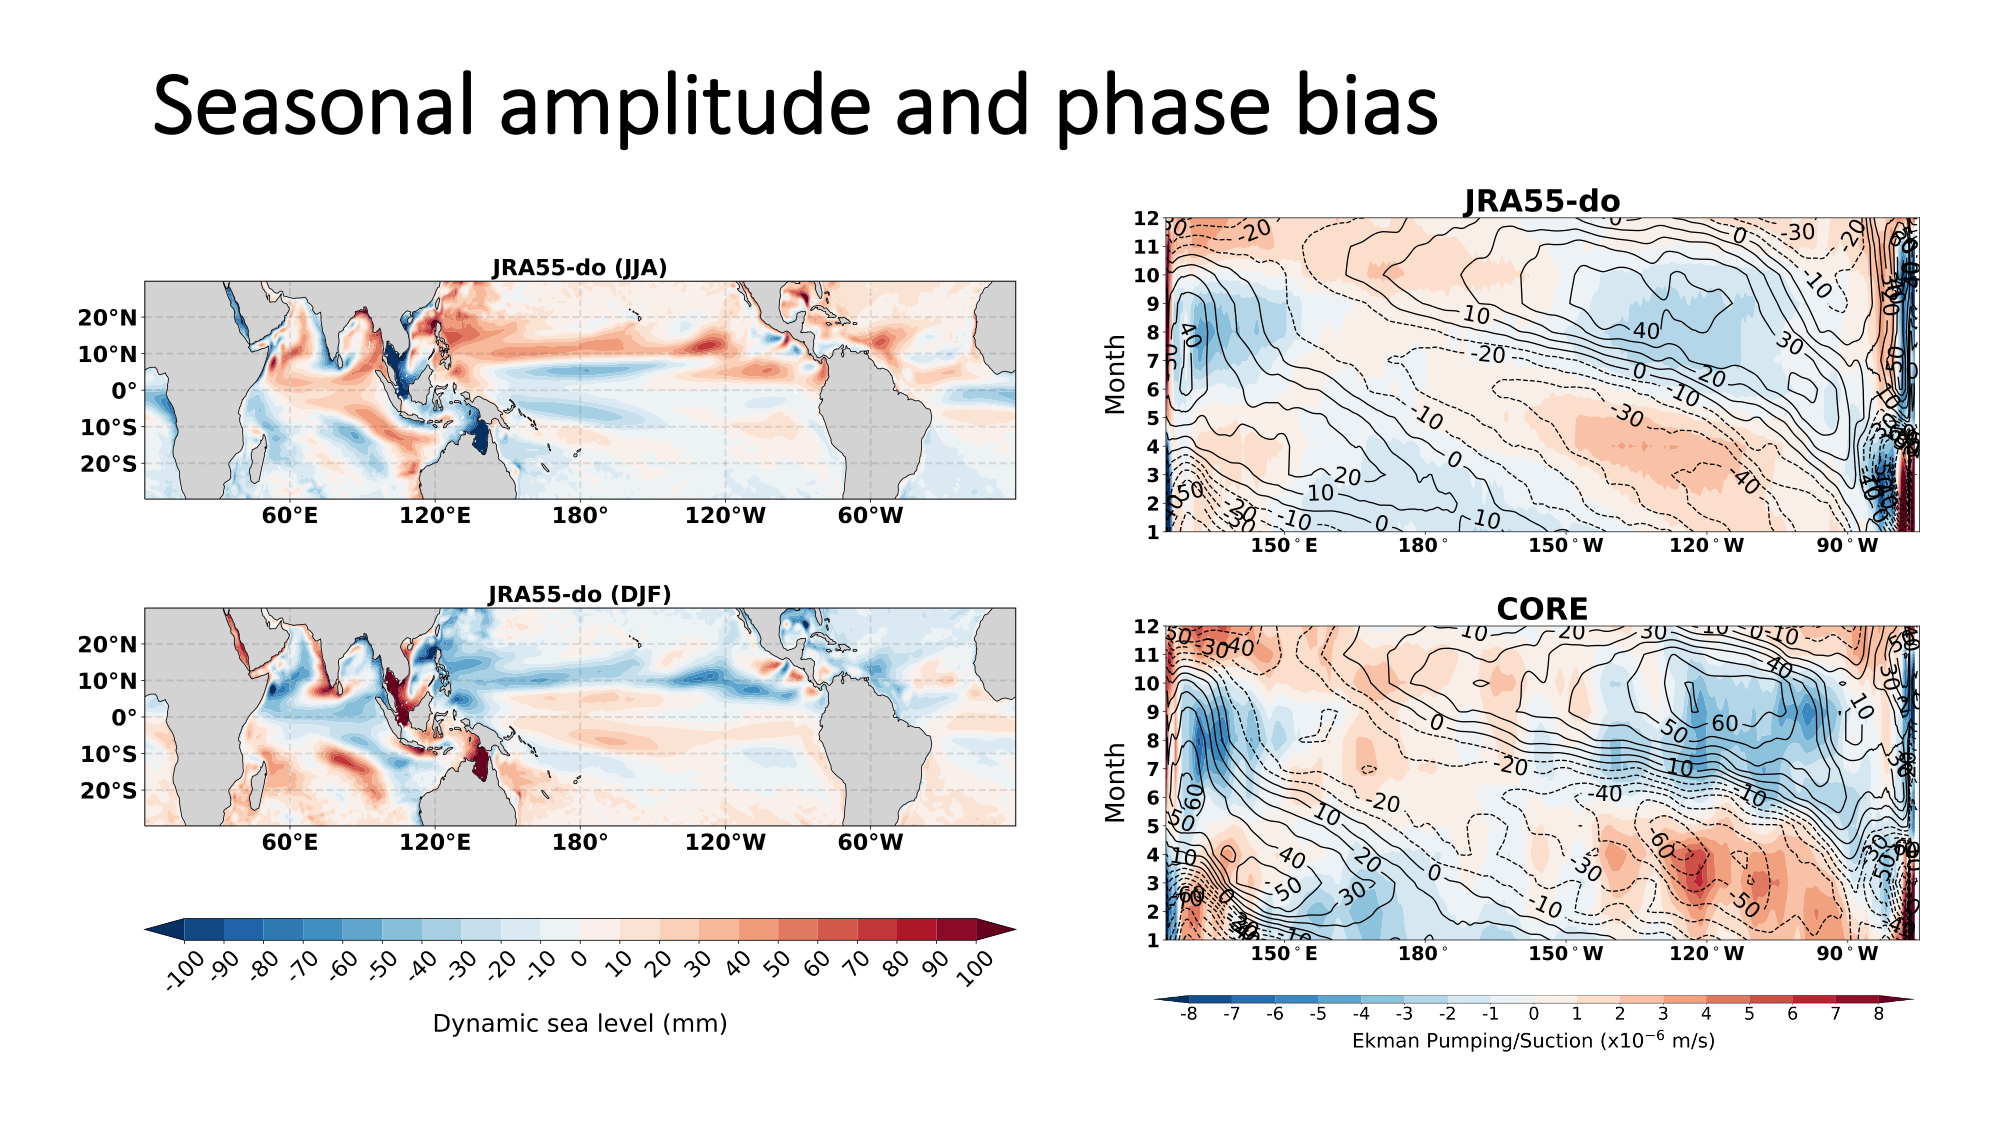 Over the seasonal time scale, sea level changes over the tropic are dominated by the first baroclinic Rossby wave between 0-10N.
In the left panel, the top figure shows the JJA mean of sea level anomaly and the bottom figure shows the DJF mean.
One can see the Rossby wave causing the dipole structure across the tropical Pacific along around 5N.
The timing of the Rossby wave propagation across the Pacific ocean plays an important role in the seasonal phase and amplitude of the zonal current.
Especially for NECC, which is affected by the meridional sea level gradient in the tropics, we find the timing of initiating the Rossby wave near the coastline of eastern tropical Pacific is the main reason for the accurate NECC phase in the JRA55-do forced simulation when comparing with observed values.
From the Hovmöller diagram showing in the right panel, a wind stress curl forcing that started too earlier at the start of the year near 90W in CORE generates a Rossby wave too early when comparing with the observational data.
Over the seasonal time scale, sea level changes over the tropic are dominated by the first baroclinic Rossby wave between 0-10N.
In the left panel, the top figure shows the JJA mean of sea level anomaly and the bottom figure shows the DJF mean.
One can see the Rossby wave causing the dipole structure across the tropical Pacific along around 5N.
The timing of the Rossby wave propagation across the Pacific ocean plays an important role in the seasonal phase and amplitude of the zonal current.
Especially for NECC, which is affected by the meridional sea level gradient in the tropics, we find the timing of initiating the Rossby wave near the coastline of eastern tropical Pacific is the main reason for the accurate NECC phase in the JRA55-do forced simulation when comparing with observed values.
From the Hovmöller diagram showing in the right panel, a wind stress curl forcing that started too earlier at the start of the year near 90W in CORE generates a Rossby wave too early when comparing with the observational data.
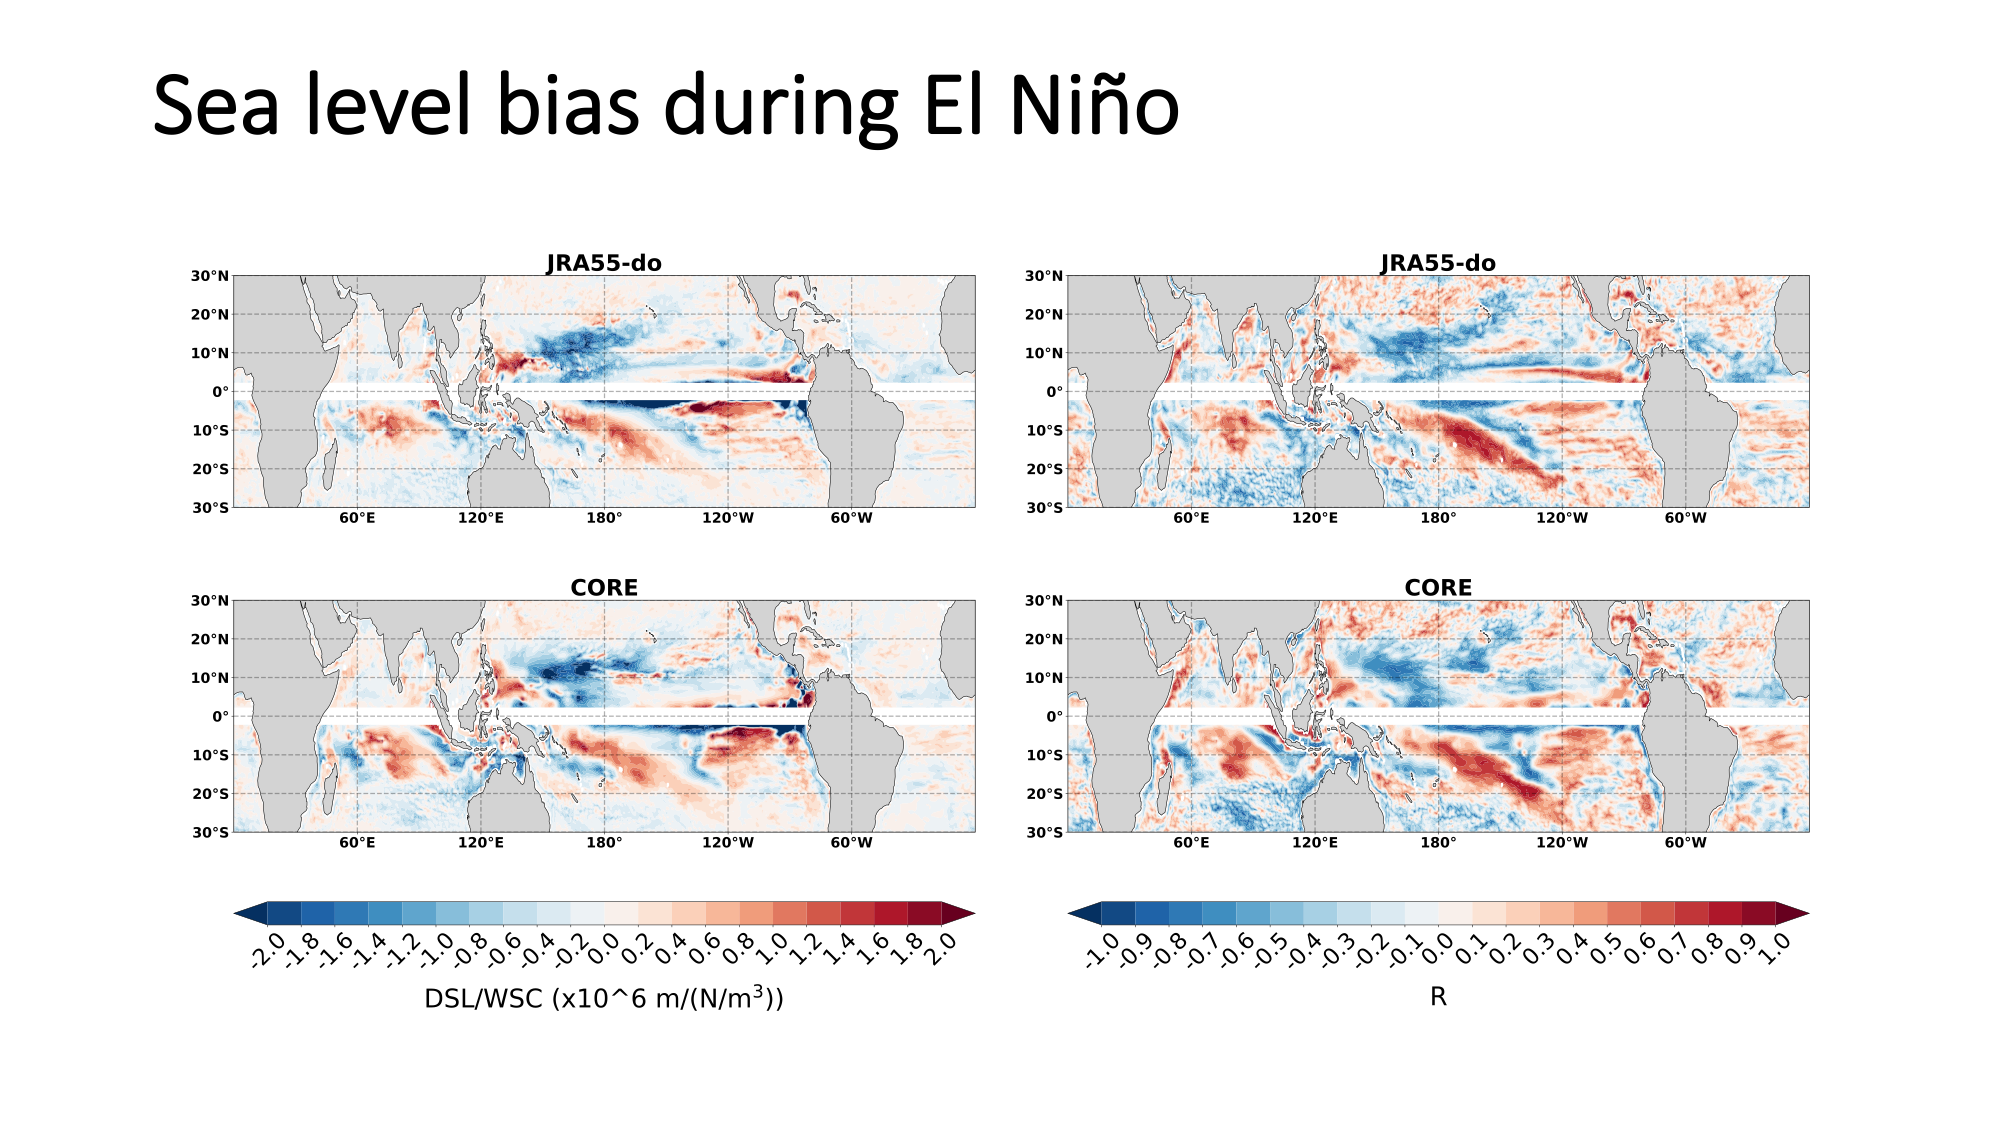 The improved wind forcing also shows improved sea level simulation during El Niño.
Though the sea level and thermal structure changes during the El Niño is still dominated by the Kelvin wave along the equator and by the Rossby wave on two sides of the equator.
We find the Ekman pumping that is associated with the wind stress curl also plays an important role in the local sea level changes.
The regression between sea level and wind stress curl at each grid point over the tropical Pacific is shown in the figure above.
We can also see that the local wind forcing also contributes to an asymmetric sea level pattern on two sides of the equator during El Niño period.
The improved wind forcing also shows improved sea level simulation during El Niño.
Though the sea level and thermal structure changes during the El Niño is still dominated by the Kelvin wave along the equator and by the Rossby wave on two sides of the equator.
We find the Ekman pumping that is associated with the wind stress curl also plays an important role in the local sea level changes.
The regression between sea level and wind stress curl at each grid point over the tropical Pacific is shown in the figure above.
We can also see that the local wind forcing also contributes to an asymmetric sea level pattern on two sides of the equator during El Niño period.
Let me know what you think of this article on twitter @Hsu_Chia_Wei!